Data & Sources for Total E-Miles Driven in the US by EV Model and OEM
Methodology:
Transparency is good! Here’s more and our methodology for the e-miles article. We took monthly EV sales data provided by the InsideEVs fantastic MONTHLY PLUG-IN SALES SCORECARD stretching back to December 2010 and then determined the monthly cumulative sales of each EV up through February 2017. For every month we multiplied the cumulative sales of the EVs with an estimate of monthly e-miles driven by that EV.
Monthly e-miles driven. Where available we used available data on annual Electric Vehicle Miles Travelled (eVMT) – that is what we are referring to as e-miles.
- this InsideEVs article graphs the Society of Automotive Engineers (SAE) and Idaho National Labs (INL) data we used for the LEAF, Gen 1 Volt, Ford Focus Electric, Ford-CMAX energi, Ford Fusion Energi, Honda Fit EV, Honda Accord Plug-in Hybrid Electric Vehicle (PHEV) and Toyota Prius PHEV
- this California Air Resource Board (CARB) report gave us additional data for Tesla Model S & BMW i3 data (on pages G-14 and G-15 – we used the median numbers) and then from pages G 45 and G 46 provided more data for FIAT 500e, RAV4, Spark and Smart Fourtwo
For EVs where we did not have data we used various methods to estimate the monthly eVMT.
| Model | Battery Range | Gas tank size | E-Miles / Month | Note: |
|---|---|---|---|---|
| Tesla Model X | 237 to 289 | 1029 | 2 | |
| Tesla Model S | 210 – 315 | 1028 | * | |
| Chevy Bolt | 238 | 1000 | 1 | |
| RAV4 | 103 | 960 | * | |
| LEAF 30 | 107 | 828 | 4 | |
| KIA Soul EV | 93 | 820 | * | |
| Mercedes B-Class EV | 85 | 809 | * | |
| LEAF 24 | 84 | 808 | * | |
| VW eGolf | 125 | 808 | * | |
| Honda Fit | 82 | 807 | ||
| Ford Focus Electric | 100 | 796 | ||
| Volt II | 53 | 8.9 | 789 | ** |
| Volt | 38 | 9.3 | 759 | ** |
| FIAT 500E | 87 | 659 | ||
| BMW i3 iREX | 80 – 114 | 1.9 – 2.4 | 641 | 5 |
| Chrysler Pacifica Hybrid | 33 | 16.5 | 614 | |
| Mitsubishi i-Miev | 59 | 600 | ||
| Kia Optima PHV | 29 | 14.5 | 514 | |
| Hyundai Sonata PHV | 27 | 14.5 | 469 | |
| Prius Prime | 25 | 11.4 | 428 | |
| BMW 330e | 22 | 10.8 | 372 | |
| Ford Fusion Energi | 21 | 14 | 361 | ** |
| Ford Cmax Energy | 21 | 13.5 | 339 | ** |
| Audi A3 – eTron | 16 | 10.6 | 282 | |
| Honda Accord PHV | 13 | 12.2 | 278 | ** |
| BMW i8 | 15 | 11.1 | 269 | |
| Porsche PanameraS-E | 15 | 21.1 | 269 | |
| BMW X5 e-drive | 14 | 22.5 | 258 | |
| BMW 740e | 14 | 12.1 | 258 | |
| Porsche Cayenne S-E | 14 | 21.1 | 258 | |
| Volvo XC90 | 13 | 13.2 | 248 | |
| Tesla Roadster | 245 | – | 247 | |
| Mercedes S550H PHV | 12 | 16.6 | 238 | |
| Mercedes GLE 550E | 10 | 21.1 | 221 | |
| Prius PHV | 11 | 11.9 | 207 | ** |
Notes: Educated Guesses for eVMT:
- For the Chevy Bolt, because its range is close to the lower end of the Tesla Model S fleet, we decided on the slightly lower (and round) number of 1,000 – a quick look at small but growing BOLT Stats community looks to confirm this guess
- Tesla X – even though the fleet of Tesla X has a larger battery pack, we kept its eVMT about the same as the Tesla Model S (we just added one extra e-mile per month)
- We increased the monthly eVMT of the Gen 2 Volt (2016, 2017) at the same percentage it increased its electric-only miles over the Gen 1 Volt – the InsideEVs notes had info on the split of Gen 1 Volt sales in October and November of 2015 and we accounted for that split in the cumulative fleet and eVMT numbers
- We used a similar method to account for the increase to a 30kWh pack in the latter model LEAF but had to arbitrarily set June of 2016 as the full crossover to that battery pack. Nissan quietly made the full transition to the larger battery pack around that time and there is no data on the transition sales
- BMW i3 BEV and iREX was blended into one range (since sales data on the two trims is not available) – the eVMT is the average of the median eVMTs of the i3 BEV and the i3 iREX from the CARB study
- For the Tesla Roadster. Fortunately, J.B. Strauble from Tesla plotted out the worldwide fleet total cumulative miles up to May of 2016, as covered by Electrek https://electrek.co/2016/12/26/tesla-global-fleet-3-5-billion-miles/ . we roughly extrapolated out the monthly increase in monthly eVMT by that fleet and added 9 months to the total. Then accounted for the fact that the U.S. Roadster fleet is estimated to be about 69% of the worldwide total
| Vehicle Model | Cumulative E-Miles as of March 2017 | % Share |
|---|---|---|
| Chevy Volt | 2,989,537,881 | 27.84% |
| Nissan LEAF | 2,921,281,752 | 27.20% |
| Tesla Model S | 2,211,662,844 | 20.60% |
| Prius PHV | 365,863,185 | 3.41% |
| Ford Fusion Energi | 346,218,855 | 3.22% |
| Ford Cmax Energi | 312,008,481 | 2.91% |
| BMW i3 | 295,938,803 | 2.76% |
| Fiat 500E | 214,068,901 | 1.99% |
| Ford Focus Electric | 173,206,416 | 1.61% |
| Tesla Model X | 145,863,948 | 1.36% |
| Spark EV | 109,364,308 | 1.02% |
| VW eGolf | 98,995,352 | 0.92% |
| RAV4 | 92,962,560 | 0.87% |
| Smart ED | 86,277,960 | 0.80% |
| Mitsubishi i-Miev | 58,009,200 | 0.54% |
| Mercedes B-Class EV | 55,015,236 | 0.51% |
| ELR | 52,072,713 | 0.48% |
| Tesla Roadster | 44,992,000 | 0.42% |
| KIA Soul EV | 35,755,280 | 0.33% |
| Honda Fit EV | 34,731,666 | 0.32% |
| BMW i8 | 19,059,188 | 0.18% |
| BMW X5 e-drive | 16,201,110 | 0.15% |
| Porsche PanameraS-E | 11,869,625 | 0.11% |
| Audi A3 – eTron | 11,291,280 | 0.11% |
| Porsche Cayenne S-E | 11,257,572 | 0.10% |
| Honda Accord PHV | 10,738,306 | 0.10% |
| Prius Prime | 5,196,348 | 0.0484% |
| Bolt | 5,013,000 | 0.0467% |
| BMW 330e | 1,926,216 | 0.0179% |
| Mercedes S550H PHV | 1,393,728 | 0.0130% |
| Mercedes GLE 550E | 301,002 | 0.0028% |
| Kia Optima PHV | 84,810 | 0.0008% |
| BMW 740e | 36,120 | 0.0003% |
| Chrysler Pacifica Hybrid | 14,736 | 0.0001% |
| Total | 10,738,253,149 |
For The Rest:
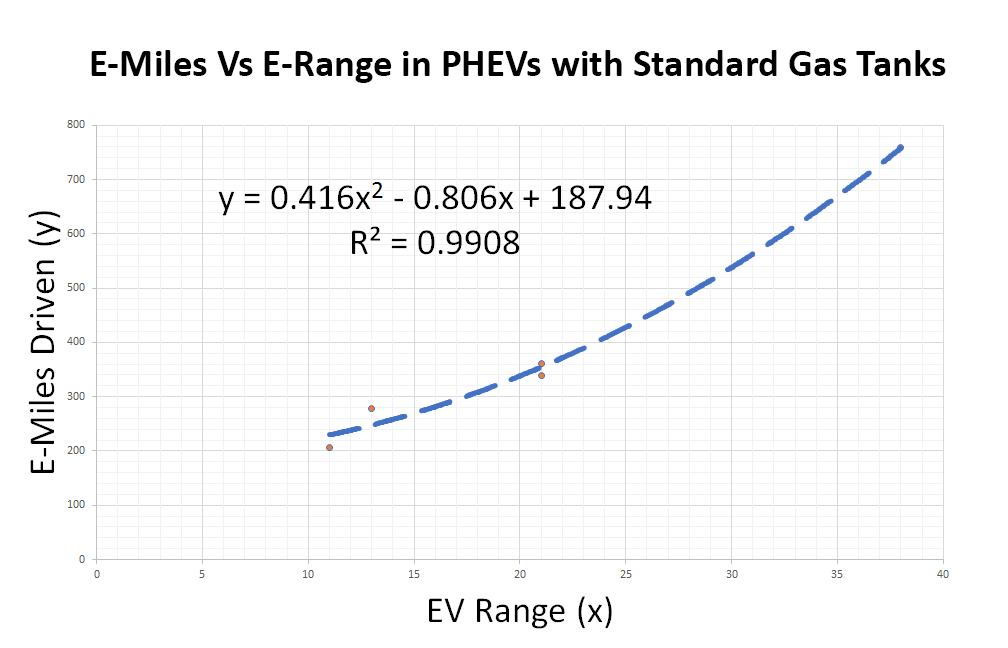 For PHEVs we used a line graph to predict the eVMT. The correlation between the EPA-rated longest battery only range and monthly eVMT was consistent when plotted (see graph to the right and table below).
For BEVs we conducted a rough eyeball method because of the inconsistency and incompleteness of the data – no such neat plotting exists when you chart out the BEV eVMT data for reasons described by the authors of the CARB study (below the data). So we placed the BEVs in a table and made guesses based loosely on what we saw.
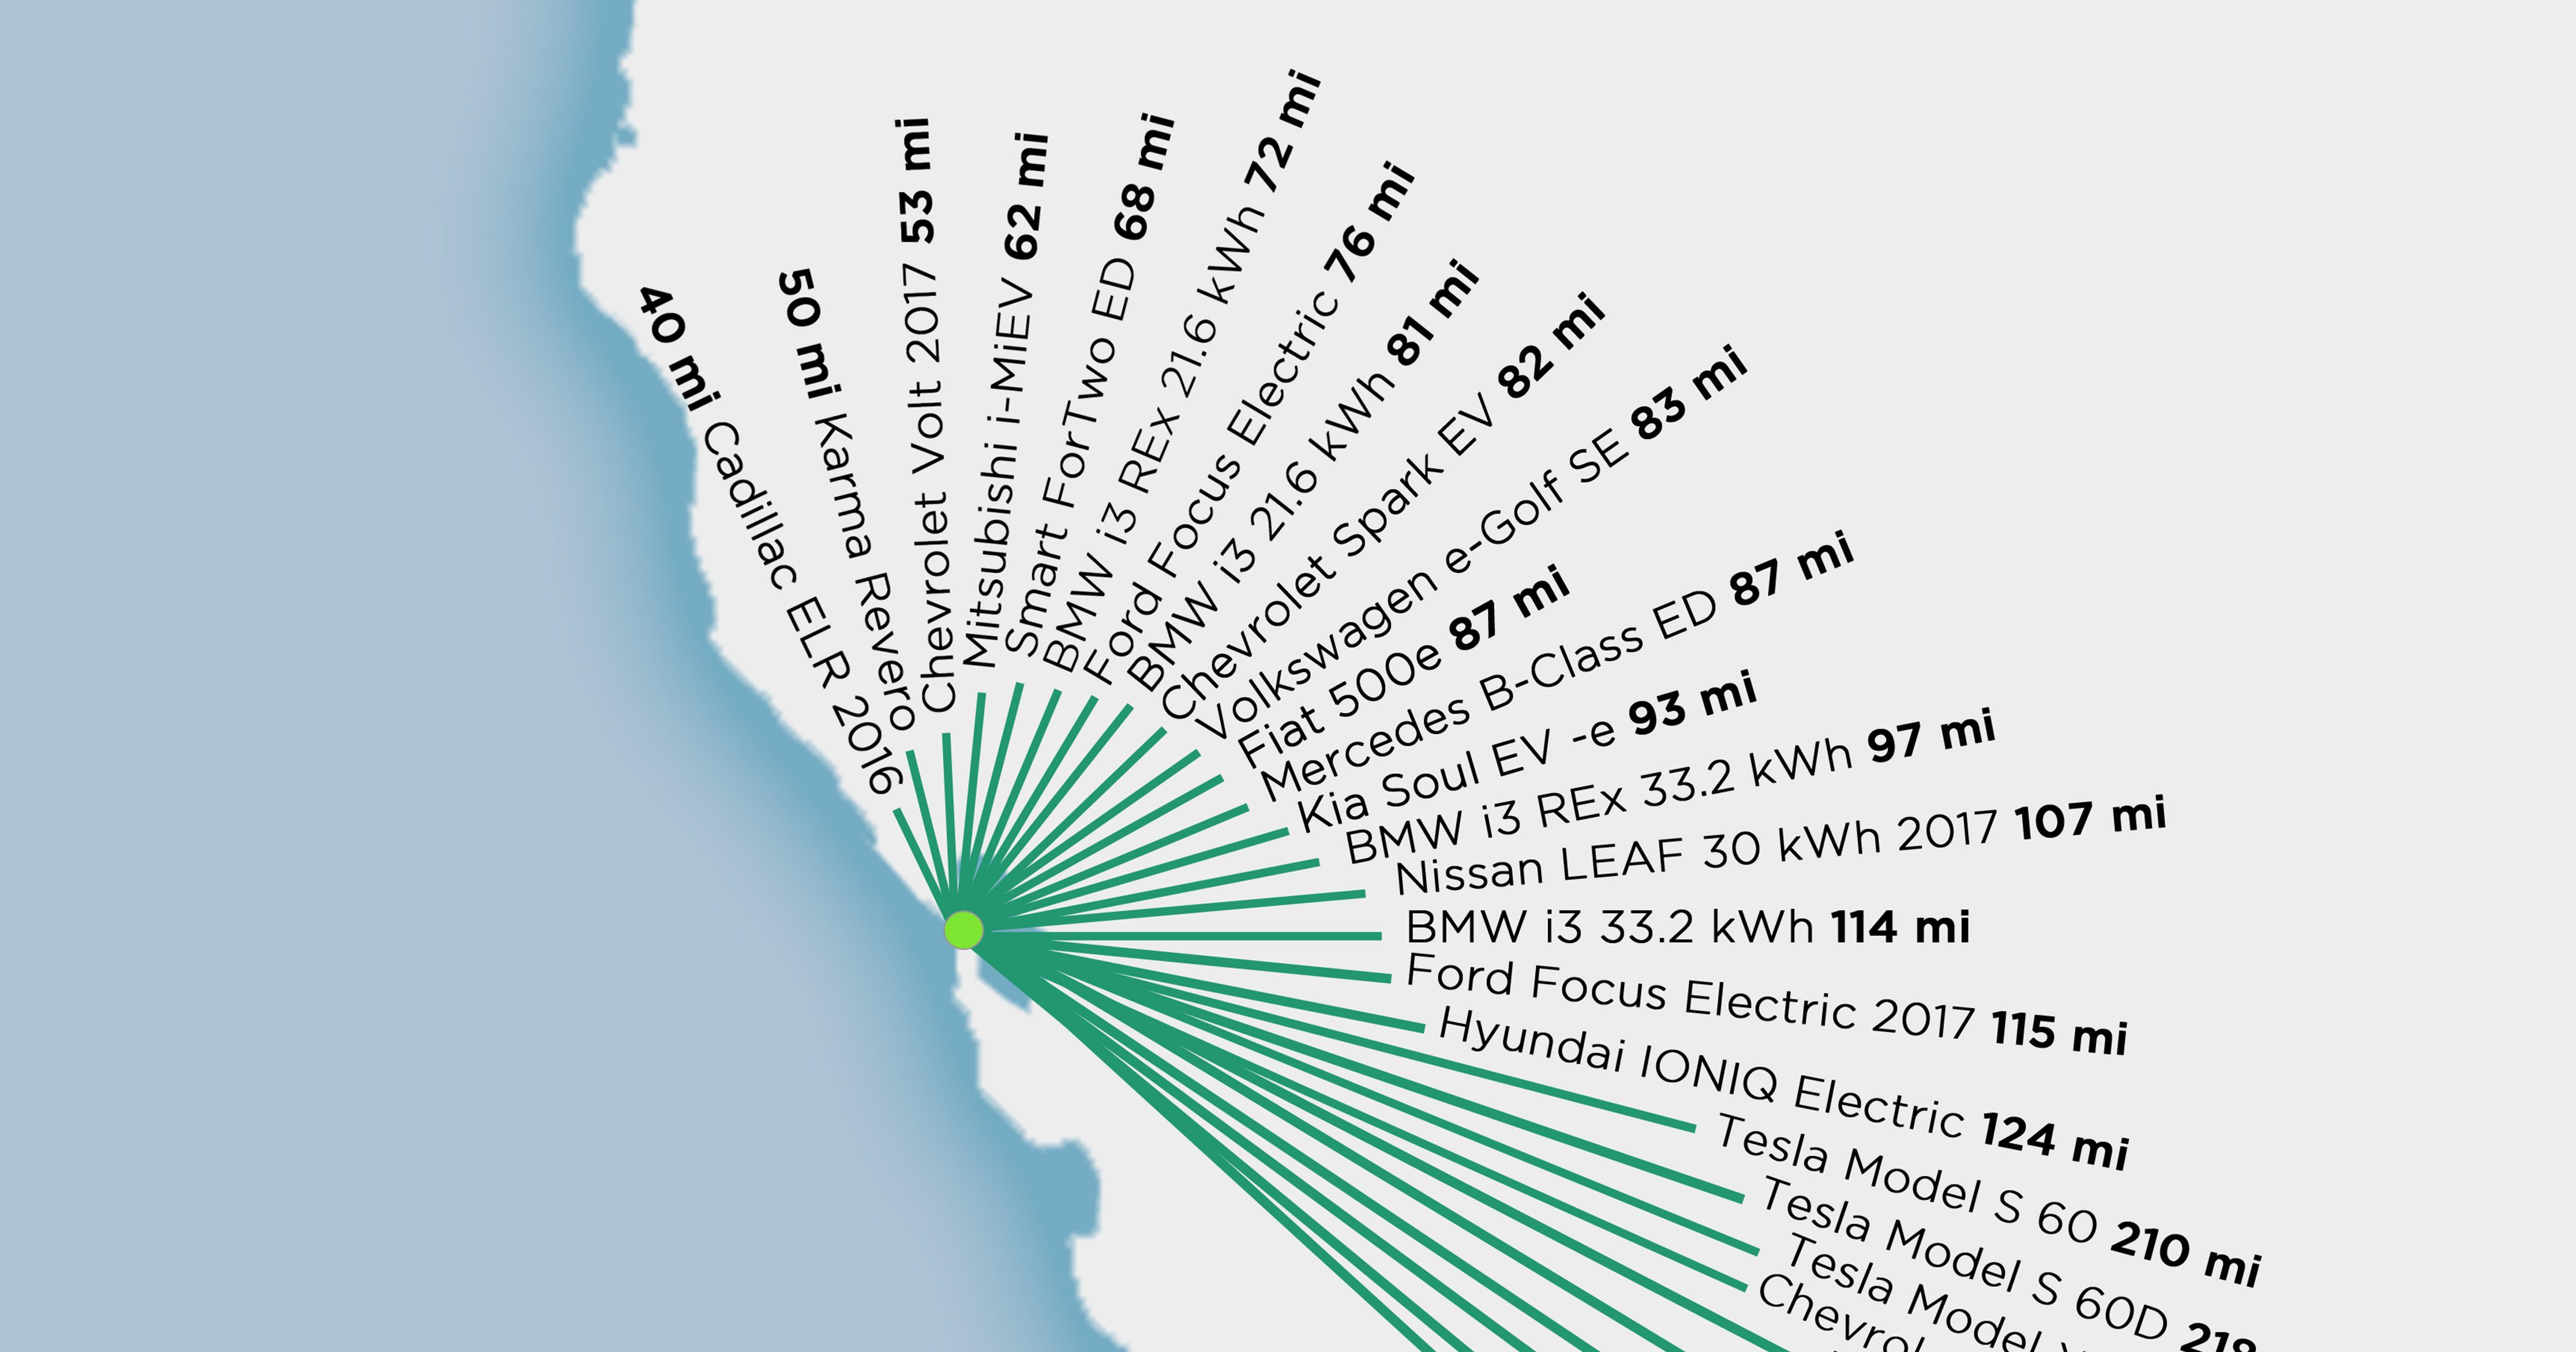
“When looking specifically at BEVs driven in California, factors such as body style, self-selection, commute, access to charging infrastructure and sharing of vehicles all seem to play a role in determining eVMT, in addition to electric range. Range alone does not explain reported eVMT. For example, the self-reported annual eVMT of the Fiat 500e (7,912 miles) is much lower than expected given its all electric range of 87 miles compared with other BEVs of similar range such as the Honda Fit EV and the Chevrolet Spark EV (11,049 and 9,167 miles). Although the Tesla Model S and Toyota RAV4 EV have very different electric ranges greater than 100 miles (265 vs 113 miles), both vehicles get fairly similar annual eVMT (12,174 vs 11,519 miles) (Nicholas, 2016). The Honda Fit EV had the highest annual eVMT (11,049 miles) of the BEVs with an electric range below 100 miles, followed by Nissan Leaf (9,511 miles), Ford Focus Electric (9,442 miles), Chevrolet Spark EV (9,167 miles), BMW i3 (8,169 miles), Fiat 500e (7,912 miles) and lastly, the Smart Fortwo (6,690 miles). Additionally, the overall share of is not dictated by vehicle range alone. For example, the Fiat 500e and the Toyota RAV4 EV contributed to the smallest and largest share of household eVMT (~37-49%).“
NOTE: This study is intended to be an approximation as there are several factors which were not included in this analysis as the data still serves our main purpose of comparing the relative e-miles rankings of various EVs and OEMs. For example, EV fleets certainly suffered losses over the years in totaled vehicles; used EVs may not be driven the same as newly purchased EVs, range can change over time, etc. Feel free to contact us with suggestions, corrections or better sources of data on eVMT estimates and we’ll update our database accordingly. For the record, we think it is pretty cool that Tesla can most likely pull most, if it not all, of this data from their fleet of EVs.
Help us Make this Data Better – send us an email.